ASSIGNMENT
The assignment for this week wad to create an interactive object or our choice. If we were already experienced with coding, we should focus on fully integrating a microcontoller into a textile circuit. If we were new to coding, we should choose an example and get it working using your own sensors and actuators. I chose to integrate a microcontroller in my project (Arduino Lilypad) while keeping the coding and interaction simple so I could achieve it with my level of electronics skills.
INSPIRATION
I want to work on heartbeat and the connection between physical and emotional wellbeing as a part of my final project. The inspiration revolves around self empathy, holistic wellbeing, body-heart connection, as well as formal abstractions of the anatomical heart.
My focus for this assignment is to develop a heart rate sensing top that can capture heartbeat and translate into pulsating LED lights. This will allow me to start experimenting with heart rate sensors as input and led as a possible output. In the future my project will be more complex, but it's a start!
OBJECTIVES & PLAN
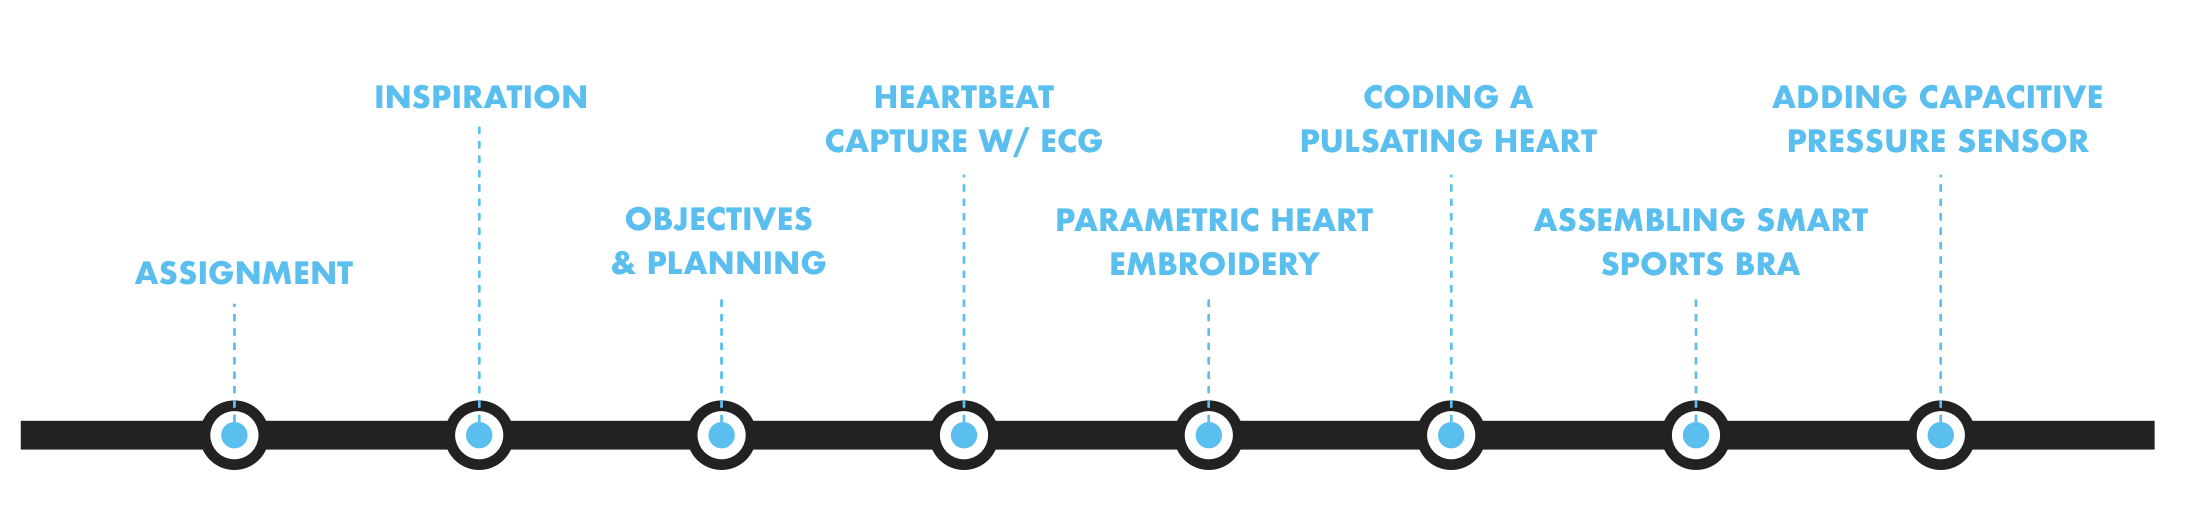
In order to ensure I have an interactive product ready for the assignment and start building my final project step-by-step, I decided to break down the process in digestible modules:
MODULE 1 - CAPTURING HEARTBEAT WITH AN ECG SENSOR
MODULE 2 - MAKING A PARAMETRIC HEART EMBROIDERY
MODULE 3 - CODING A PULSATING HEART
MODULE 5 - ASSEMBLING A SMART SPORTS BRA
MODULE 4 - ADDING A CAPACITIVE PRESSURE SENSOR
In the next step, the goal is to experiment making an optical heart beat sensor, and to compare it with the ECG for accuracy and wearability.
MODULE 1 - CAPTURING HEARTBEAT WITH AN ECG SENSOR
I wanted to start playing with heartbeat sensors, so I hooked up the Sparkfun AD8232 Heart Rate Monitor and tried the tutorial here , to create a monitor for my cardiac activity.
INGREDIENTS
- Arduino UNO
- Sparkfun AD8232 Heart Rate Monitor
- Jumper Wires
- Connection cable
- Arduino IDE
- Processing IDE
PROCEDURE
First of all, I connected the ECG sensor to the Arduino UNO according to the diagram. The only thing that changed is that the Arduino they use is an Arduino Pro Mini 328, so you have to pay some attention on how you hook it up to the UNO. Or you can use the Arduino recommended in the tutorial.

The hookup on Arduino went smoothly. The only difference with the UNO is that it has 3.3V or 5V instead of VCC, so I checked the AD8232 datasheet and found that I need to use the 3.3V.
Next came copy pasting the code below on the Arduino IDE and upload it on my Arduino UNO. This code works in combination with Processing, in order to visualize a graph of the heart beat. Essentially the instructions here allow Arduino to communicate with Processing.
/******************************************************************************
Heart_Rate_Display.ino
Demo Program for AD8232 Heart Rate sensor.
Casey Kuhns @ SparkFun Electronics
6/27/2014
https://github.com/sparkfun/AD8232_Heart_Rate_Monitor
The AD8232 Heart Rate sensor is a low cost EKG/ECG sensor. This example shows
how to create an ECG with real time display. The display is using Processing.
This sketch is based heavily on the Graphing Tutorial provided in the Arduino
IDE. http://www.arduino.cc/en/Tutorial/Graph

Resources:
This program requires a Processing sketch to view the data in real time.
Development environment specifics:
IDE: Arduino 1.0.5
Hardware Platform: Arduino Pro 3.3V/8MHz
AD8232 Heart Monitor Version: 1.0
This code is beerware. If you see me (or any other SparkFun employee) at the
local pub, and you've found our code helpful, please buy us a round!
Distributed as-is; no warranty is given.

******************************************************************************/

void setup() {
// initialize the serial communication:
Serial.begin(9600);
pinMode(10, INPUT); // Setup for leads off detection LO +
pinMode(11, INPUT); // Setup for leads off detection LO -
}
void loop() {
if((digitalRead(10) == 1)||(digitalRead(11) == 1)){
Serial.println('!');
}
else{
// send the value of analog input 0:
Serial.println(analogRead(A0));
}
//Wait for a bit to keep serial data from saturating
delay(1);
}

Once I uploaded the code I had to attach the three sensors (red, blue and black) on to my body as suggested in the image on the tutorial: BLUE on the left of my chest, BLACK on the right of my chest, RED on the right of my bellybutton. This way i could start getting values by opening Serial Monitor on my Arduino IDE. At this point the values come in rows of 7, but there is no graphical representation of what that "looks like". Time for Processing.

I downloaded Processing from here. It is a flexible software sketchbook and a language for learning how to code within the context of the visual arts.
Once the program was dowloaded, I uploaded the code below.
/******************************************************************************

Heart_Rate_Display.ino
Demo Program for AD8232 Heart Rate sensor.
Casey Kuhns @ SparkFun Electronics
6/27/2014
https://github.com/sparkfun/AD8232_Heart_Rate_Monitor

The AD8232 Heart Rate sensor is a low cost EKG/ECG sensor. This example shows
how to create an ECG with real time display. The display is using Processing.
This sketch is based heavily on the Graphing Tutorial provided in the Arduino
IDE. http://www.arduino.cc/en/Tutorial/Graph

Resources:
This program requires a Processing sketch to view the data in real time.
Development environment specifics:
IDE: Arduino 1.0.5
Hardware Platform: Arduino Pro 3.3V/8MH
AD8232 Heart Monitor Version: 1.0
This code is beerware. If you see me (or any other SparkFun employee) at the
local pub, and you've found our code helpful, please buy us a round!
Distributed as-is; no warranty is given.

******************************************************************************/

import processing.serial.*;
Serial myPort; // The serial port
int xPos = 1; // horizontal position of the graph
float height_old = 0;
float height_new = 0;
float inByte = 0;
void setup () {
// set the window size:
size(1000, 400);
// List all the available serial ports
println(Serial.list());
// Open whatever port is the one you're using.
myPort = new Serial(this, Serial.list()[2], 9600);
// don't generate a serialEvent() unless you get a newline character:
myPort.bufferUntil('\n');
// set inital background:
background(0xff);
}
void draw () {
// everything happens in the serialEvent()
}
void serialEvent (Serial myPort) {
// get the ASCII string:
String inString = myPort.readStringUntil('\n');
if (inString != null) {
// trim off any whitespace:
inString = trim(inString);
// If leads off detection is true notify with blue line
if (inString.equals("!")) {
stroke(0, 0, 0xff); //Set stroke to blue ( R, G, B)
inByte = 512; // middle of the ADC range (Flat Line)
}
// If the data is good let it through
else {
stroke(0xff, 0, 0); //Set stroke to red ( R, G, B)
inByte = float(inString);
}
//Map and draw the line for new data point
inByte = map(inByte, 0, 1023, 0, height);
height_new = height - inByte;
line(xPos - 1, height_old, xPos, height_new);
height_old = height_new;
// at the edge of the screen, go back to the beginning:
if (xPos >= width) {
xPos = 0;
background(0xff);
}
else {
// increment the horizontal position:
xPos++;
}
}
}
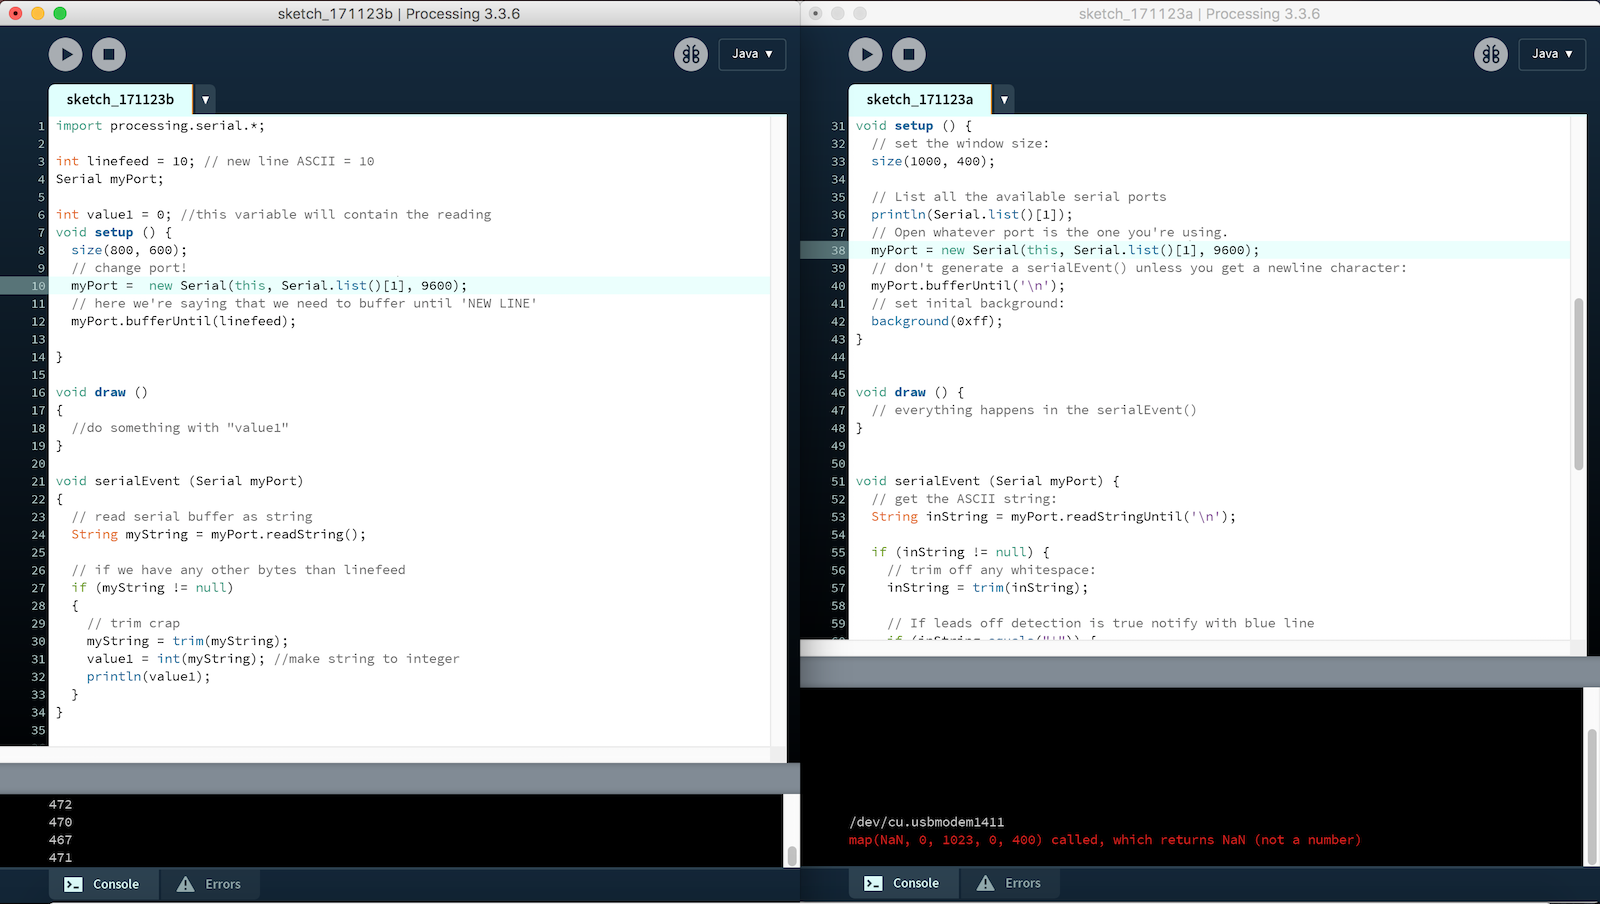
The issues came when I tried to display the ECG on Processing. I continuously got the error
Error, disabling serialEvent() for /dev/cu.usbmodem1411
null

I went on this forum to troubleshoot my issue, and found that one user solved it by downloading the 2.2.1 version of Processing. It worked! Now I can visualize my heartbeat easily on the screen. Then I found out that the tutorial on Sparkfun also warned about the same issue, but I guess I didn't pay close enough attention :S

Here is the dynamic graph which is visualized on Processing. It's my heart!
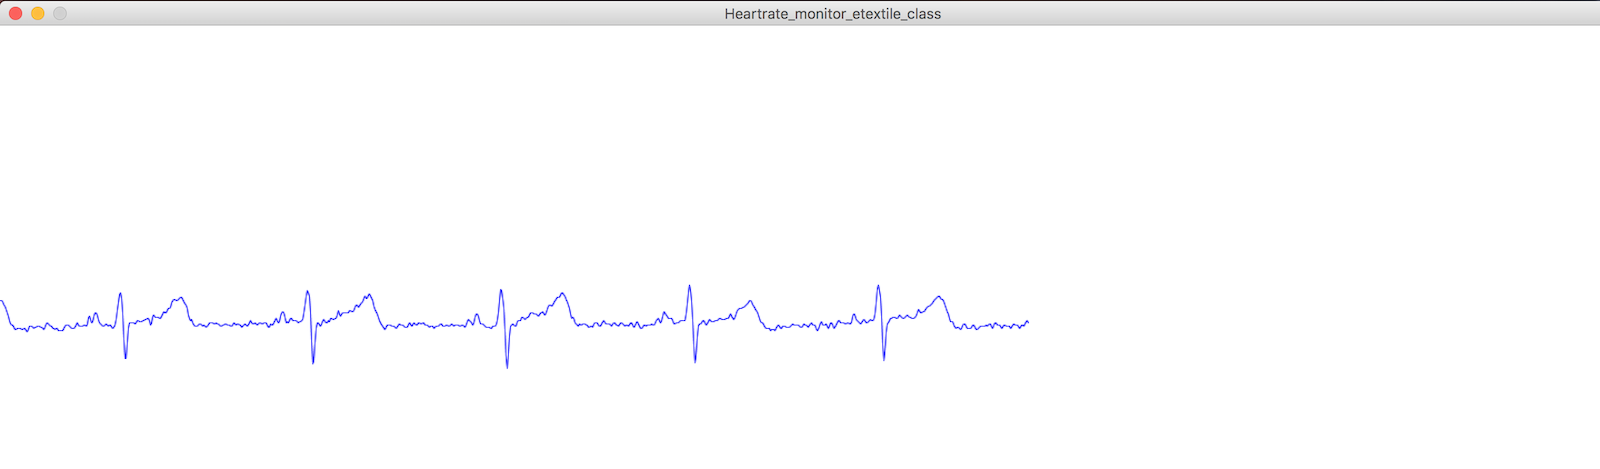
I also found out how to change the color of the graph. Can you find out as well? I challenge you ;)
RESULTS & REFLECTIONS
- The heartbeat sensor tutorial was overall quite straightforward and it was very satisfying to be able to visualize my heartbeat on a graph in such a short time.
- The mistake in using the wrong version of Processing came from a bit of distraction, which reminds me to READ THE TUTORIAL THOROUGHLY!
- In regards to the sensor placement on the body, it is a bit intrusive and it doesn't make a very comfortable wearable. The sensors have to be applied directly on the skin with disposable stickers, which makes them both not eco-friendly nor comfortable for a daily use.
PARAMETRIC HEART EMBROIDERY

I wanted to create an illustration for a parametric version of an anatomical heart. I already experimented with the Delaunay Edges command and I liked the triangulation effect.
INGREDIENTS
- Sketching material
- Rhino Wip for Mac
- Grasshopper for Mac
- Red thread
- Cotton Fabric
- Needle
- Scissors
- Conductive Thread
- Lilypad LEDs in multiple colors
- Cotton Fabric
- Lilypad Battery Holder
PROCEDURE
- First I sketched a parametric heart outline, in order to get an idea of what I wanted it to look like.
- Then I uploaded the drawing as a background on Rhino using the command View>Background Bitmap>Place.
- I created the outlines of the heart using the command Polyline and placed a lot of points inside the area using the command Multiple Points.
- Then I opened Grasshopper and used the command Mesh>Triangulation>Delaunay edges to create a nice parametric geometric design in a couple steps.
- I then laid the cotton fabric on top of my computer screen and traced the lines on the cotton fabric.
- I stitched the embroidery with red thread.


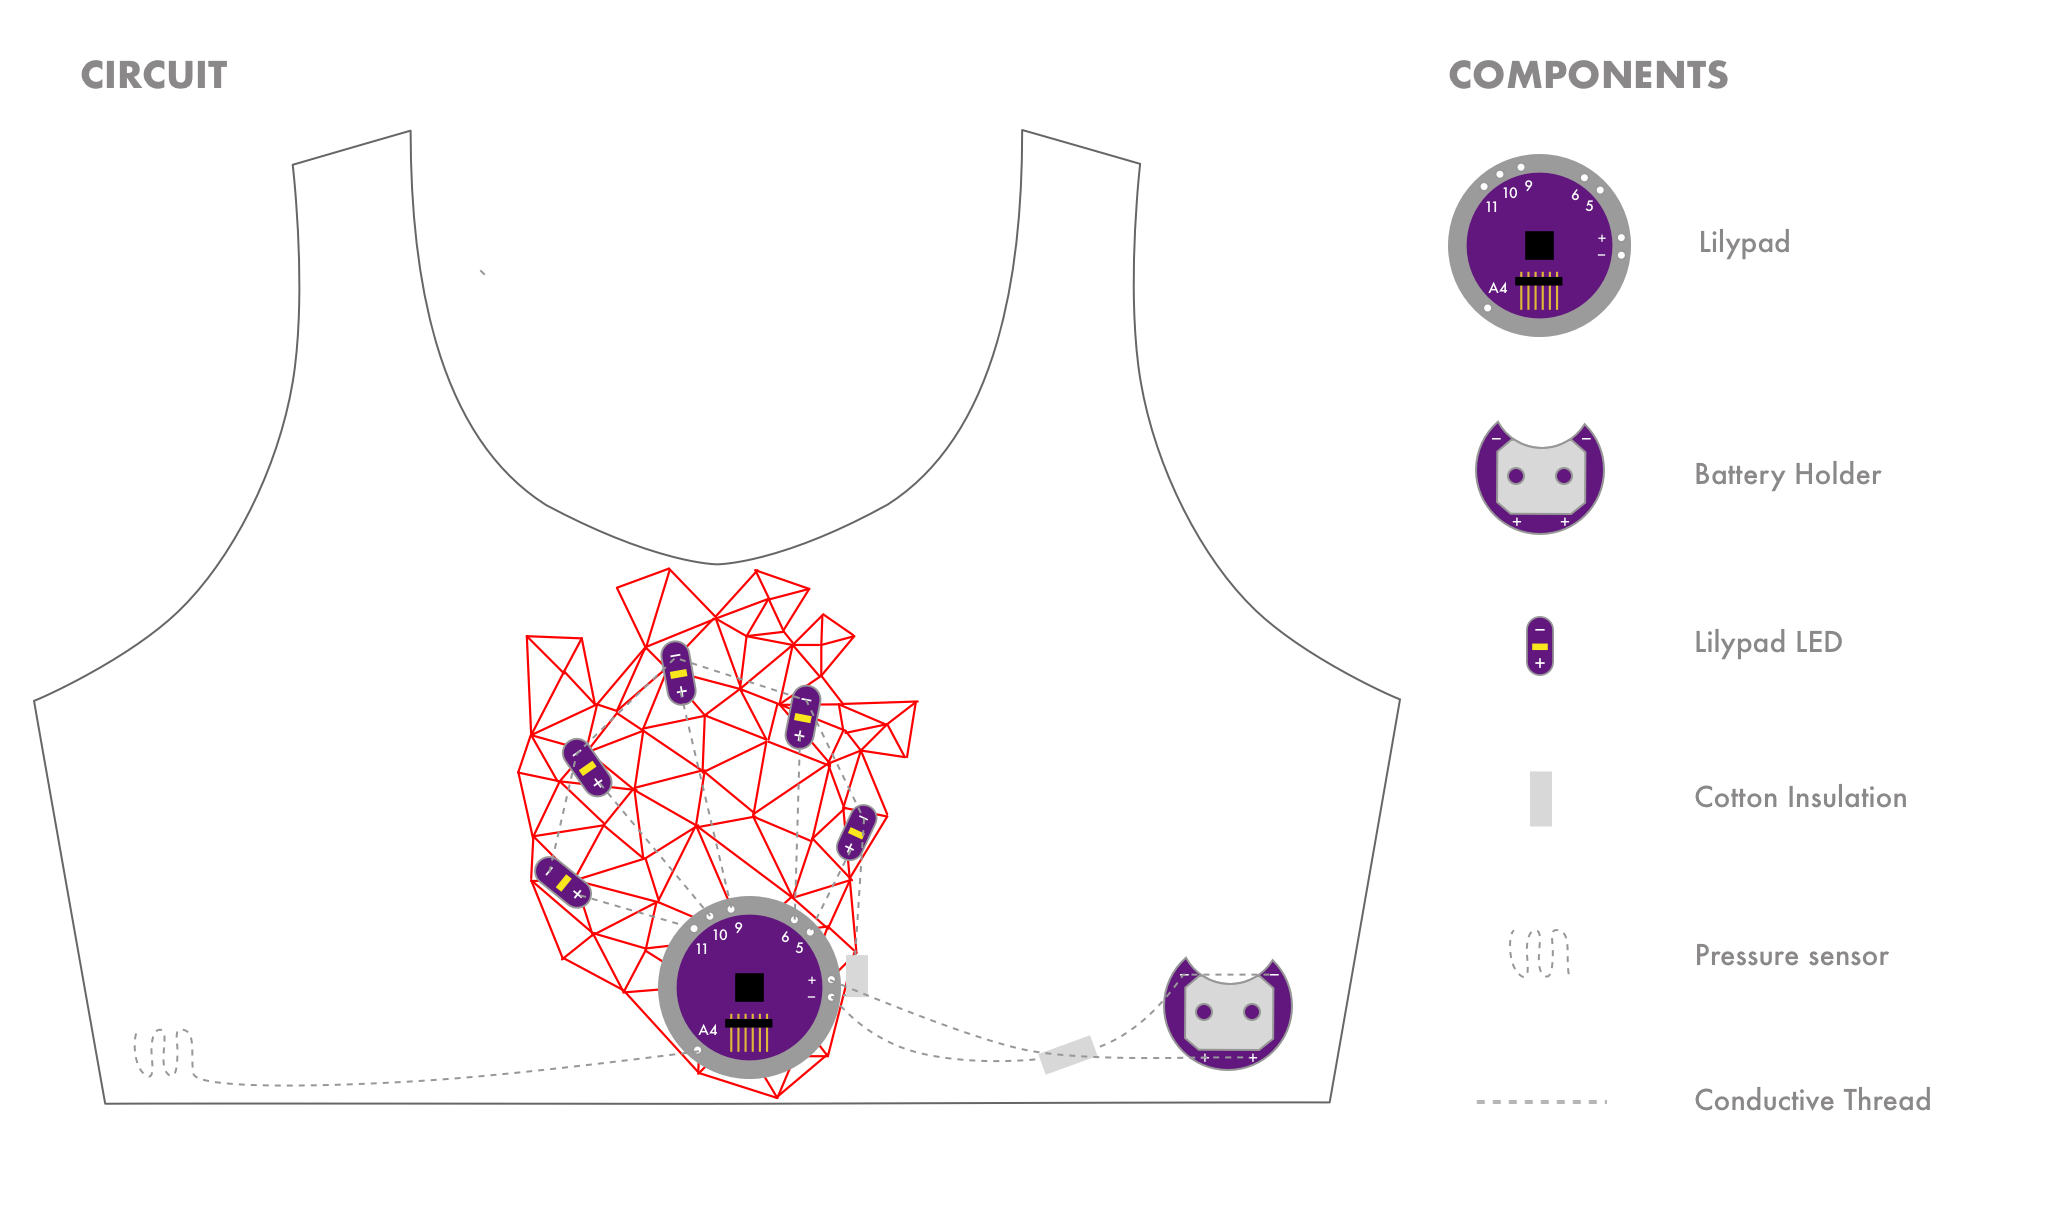
Then I drew the circuit:
And started sewing the LEDs with conductive thread.
Once I connected all the + sides to the Lilypad, I realized I didn't;t have enough conductive thread left. I had another one, but about 1/2 as thick.
So I took my multimeter and measured the resistance of the two threads:
THREAD 1 270 - 280 Ohm
THREAD 2 900 - 940 Ohm
So the second thread has three times the resistance of the first. I believe this will be an issue for the circuit, so I will go and find a way to make the circuit with the same thread.
thread.
Here is a link to help choose the right type of conductive thread and in general how to understand conductive's thread's behavior.

The 2 different conductive threads
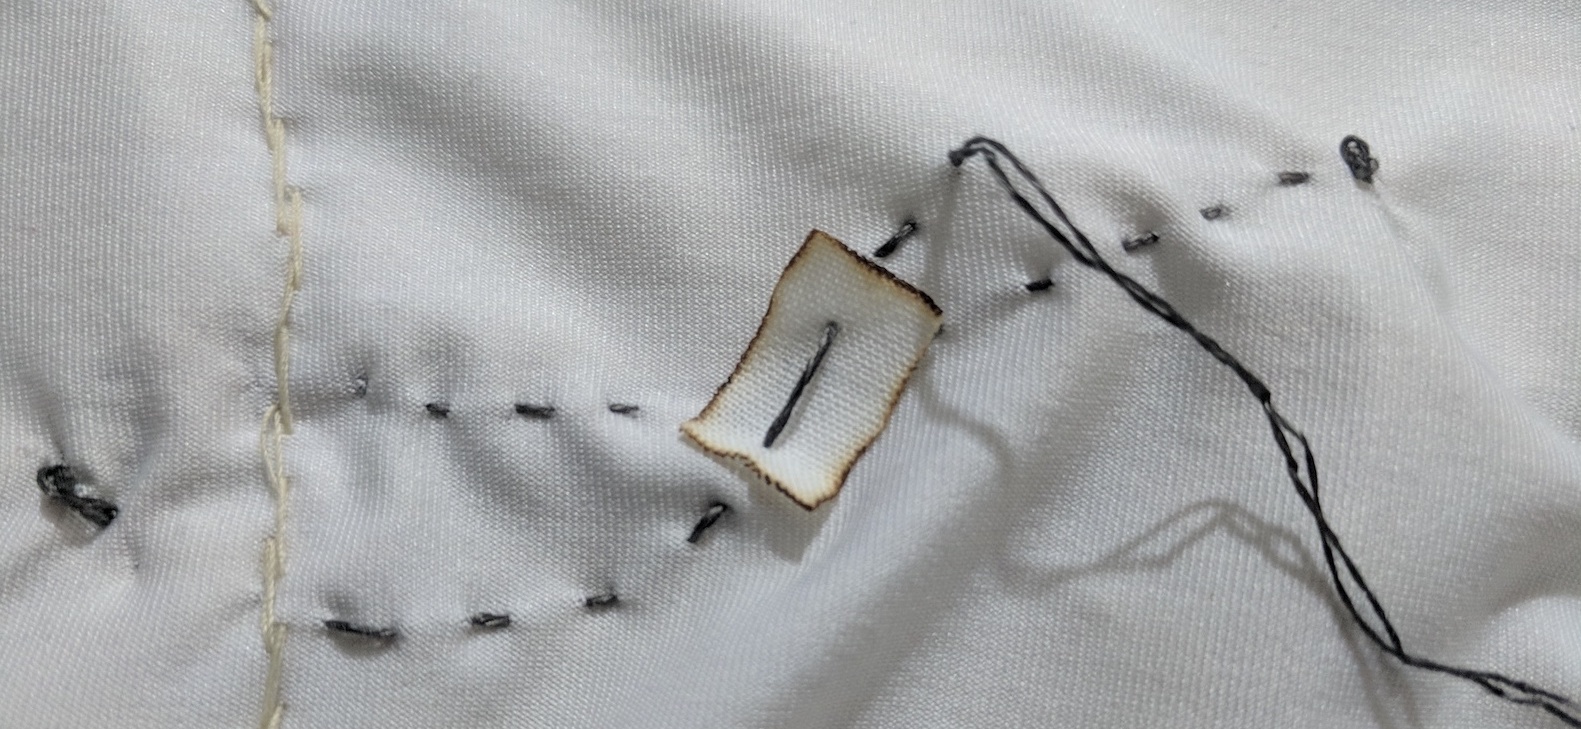
Cotton insulating patch to avoid short circuit between the two conductive threads
RESULTS & REFLECTIONS
- Designing the circuit diagram in advance proved absolutely critical to ensure I place the conductive thread in the most efficient pathway, and minimize the threads that overlap.
- When the threads overlapped, I used a little piece of cotton fabric in-between the two threads in order to avoid short circuit. Next time I should use a thicker fabric, as cotton is not as thick to prevent shorting 100%.
- The learning experience about the resistence of the conductive threads depending on the length and thickness was enlightening, highlighting another nuance to keep track of when creating soft circuits.

CREATING A PULSATING HEART
Now that I had the hardware hooked up, I was ready to program the Arduino Lilypad so the LEDs would light up in a fashion that resembled the heartbeat.
INGREDIENTS
- Arduino Lilypad
- Arduino IDE
PROCEDURE
I broke down the interaction in its 2 main components:
INPUT - A capacitive pressure sensor (while waiting to add the heartbeat sensor)
OUTPUT - Fade in fade out LEDs
On Arduino, I tried to build up my skills by starting with two different sketches:
- LEDs blinking in series
- LEDs Fading in and out
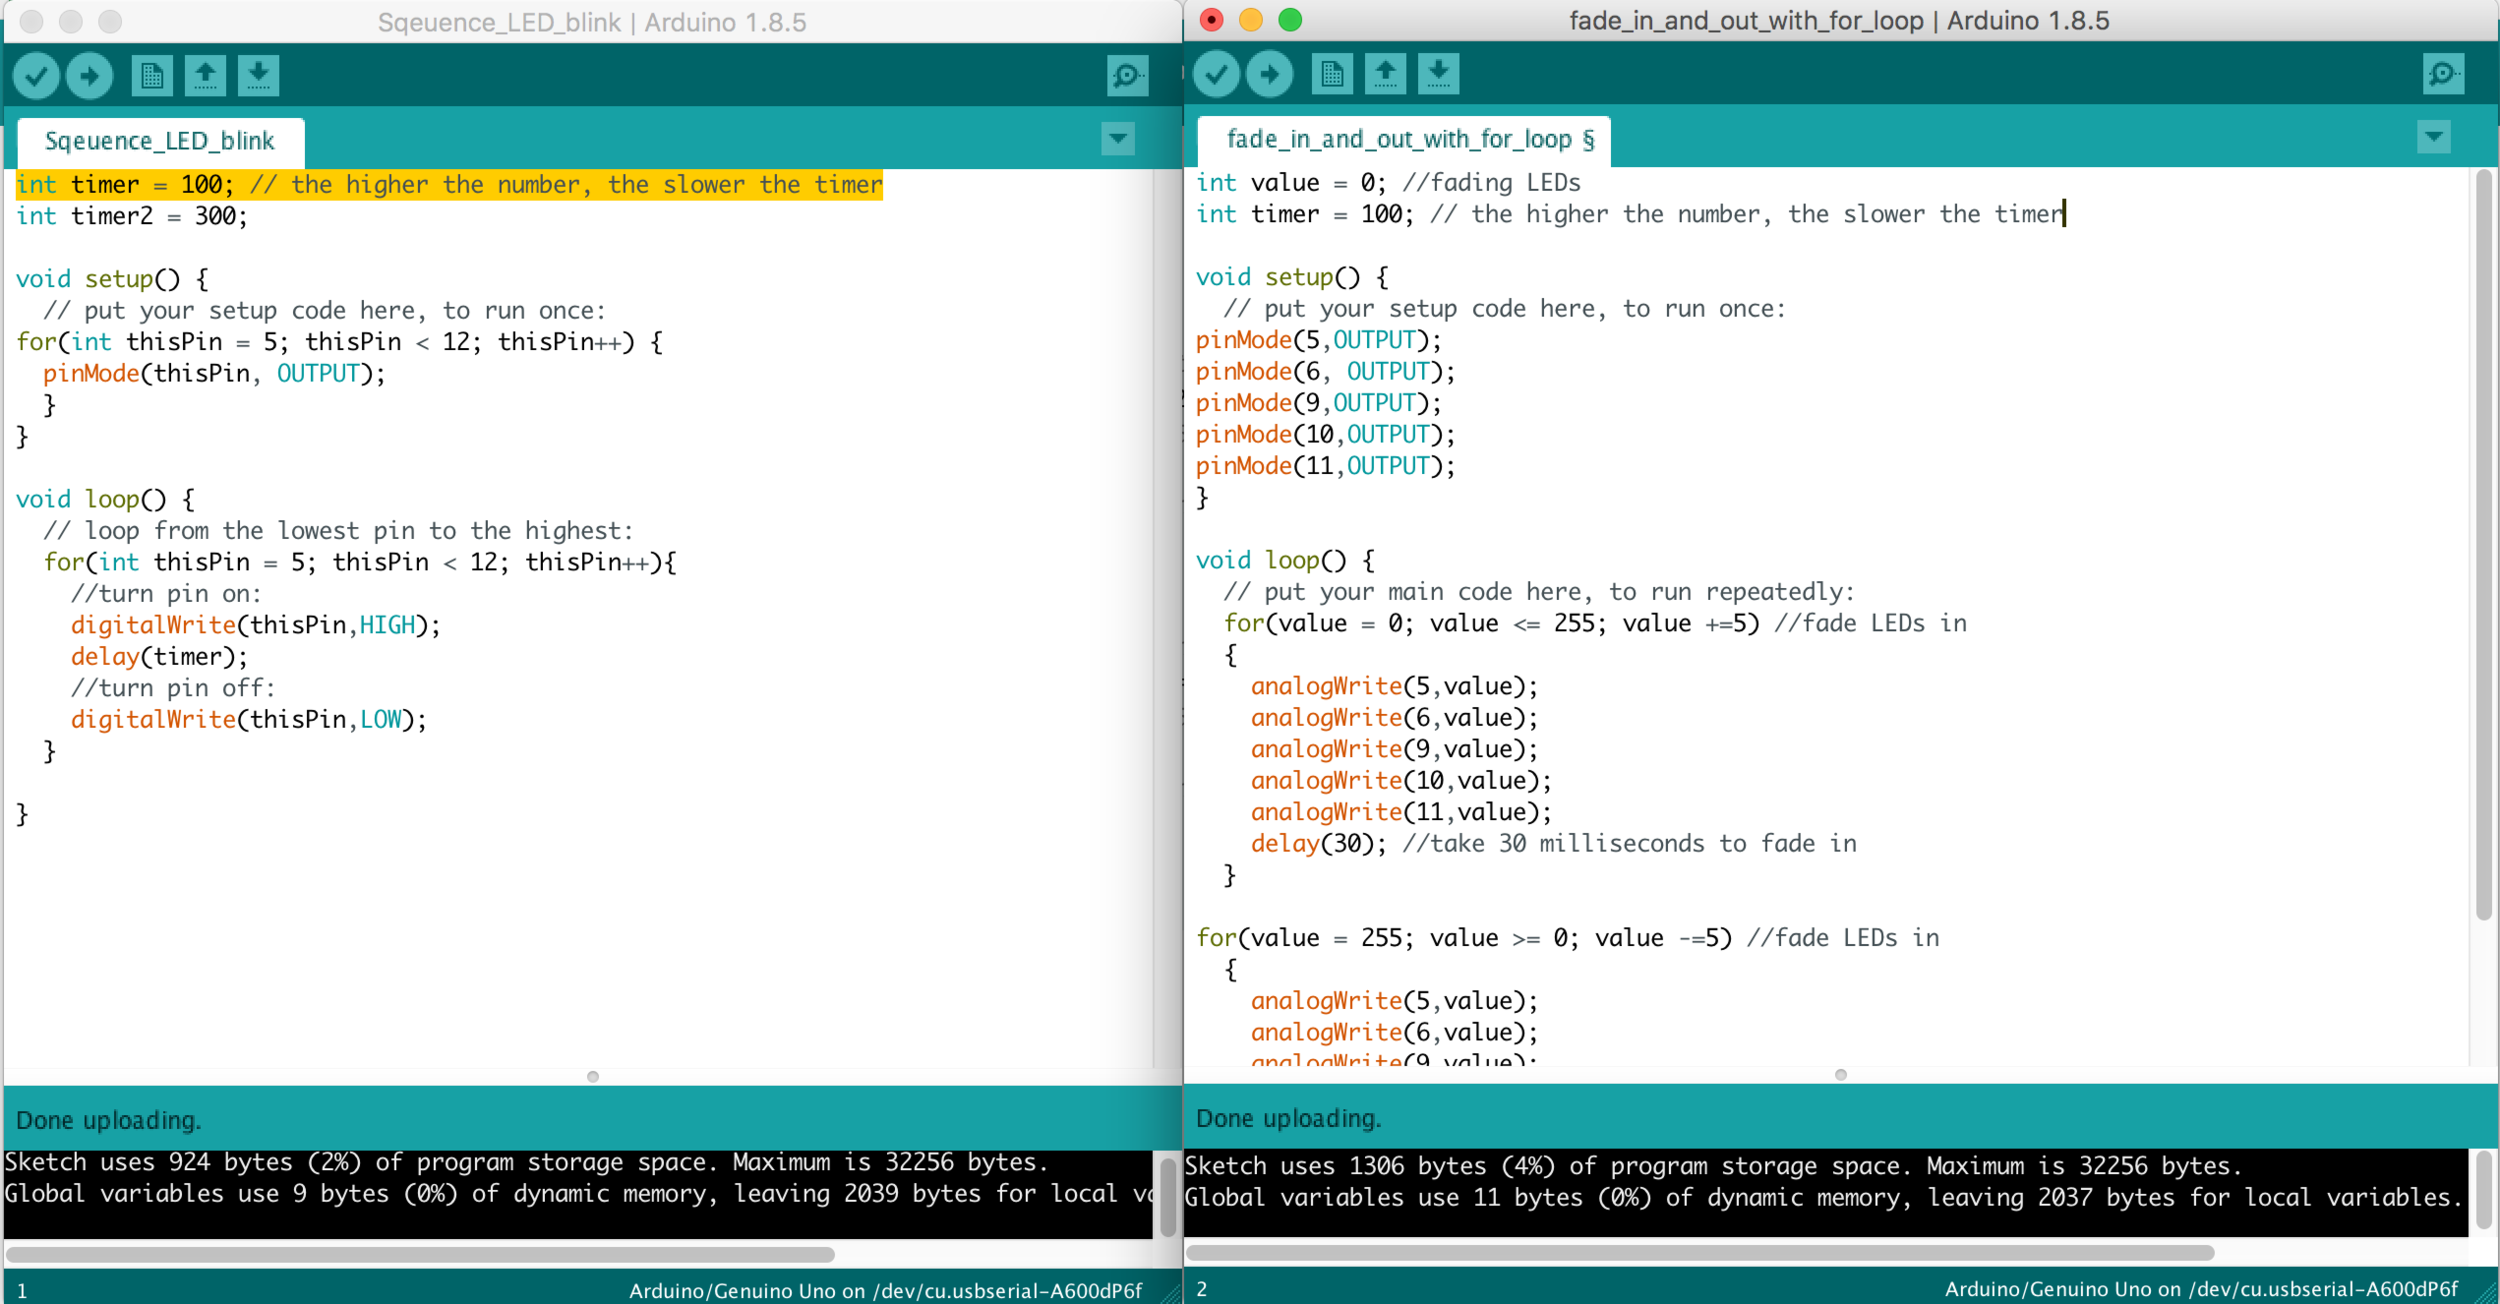
My goal was to obtain a fade in and out effect that created the effect of a heart beat, so with a rhythm to it. I ended up playing with the fade in and out delay() and fade() values, creating a longer fade in and a shorter fade out.
Here is the code I used:
int value = 0; //fading LEDs

void setup() {
  // put your setup code here, to run once:

pinMode(5,OUTPUT);
pinMode(6, OUTPUT);
pinMode(9,OUTPUT);
pinMode(10,OUTPUT);
pinMode(11,OUTPUT);

}
void loop() {
  // put your main code here, to run repeatedly:

  for(value = 0; value <= 255; value +=1) //fade LEDs in
  {
    analogWrite(5,value);
    analogWrite(6,value);
    analogWrite(9,value);
    analogWrite(10,value);
    analogWrite(11,value);
     delay(10); //take 30 milliseconds to fade in
  }
for(value = 255; value >= 0; value -=5) //fade LEDs out
  {
    analogWrite(5,value);
    analogWrite(6,value);
    analogWrite(9,value);
    analogWrite(10,value);
    analogWrite(11,value);
    delay(10); //take 30 milliseconds to fade in
   }
  }
RESULTS & REFLECTIONS
- The coding was not too difficult, yet I did struggle a bit with the for() loop initially.
- Playing with fade() values gave some interesting results, and allowed me to work on the nuances of the pulsing visualization, in order to make it feel ALIVE.
- In the future I would like to render an even more realistic effect by playing with the modulation of the LEDS.
ASSEMBLING A SMART SPORTS BRA
INGREDIENTS
- Rhino Wip for Mac
- Pattern Paper
- Scissor
- White Lycra
- White Thread
- Sewing Machine

PROCEDURE
- I created the pattern by using a bralette I have, i could ensure it fits me.
- Checked the pattern with online sports bra patterns, in order to give it a more sporty look.
- Made the pattern on the pattern paper and then took a photograph of it.
- Uploaded the photograph of the pattern as a background in Rhino Wip, by using the command View>Background Bitmap>Place
- I made the pattern in Rhinoceros by using the command Polyline, Control Point Curve and Mirror.
- I exported the pattern in .dxf format to get it ready to laser cut
- I uploaded the .dxf file and laser Cut the pattern (speed 12, Power 18)
- I sewed the two pieces of the bra with a sewing machine

RESULTS & REFLECTIONS
- The bra was easy to design and make, and it worked for an initial prototype.
- For the realization of a real bra, I will need to use thicker lycra and create some structure to sustain the breasts and keep the fit.
MAKING A CAPACITIVE PRESSURE SENSOR
This capacitive pressure sensor is going to substitute the heart rate sensor in this iteration, so I can add an INPUT that will cause the OUTPUT of the pulsating LEDs.
I used the tutorial Fabric Piano in the book Sew Electric, written by Leah Bueckley (the inventor of the Lilypad) and Kanjun Qiu. The piano keys are capacitive pressure sensors and I found the tutorial delightfully comprehensible and very achievable :)
INGREDIENTS
- Conductive thread
- Needle
- The sports bra
PROCEDURE
- Step 1 - Sew the conductive yarn from Pin A4 to a side of the sports bra
- Step 2 - Writing and uploading the code for the pressure sensor from Sew Electric on the Arduino IDE
- Step 3 - Testing if it the code makes the sensor behave as envisioned
- Step 4 - Putting together the Pressure Sensor input with the LED fade in and out output.
Here is the final code:
int pressure = A4; // name of my capacitive pressure sensor
int touchValue; //will store sensor readings
int flag = 0;
int value = 0; //fading LEDs
int led5 = 5;           // the pin that the LED is attached to
int led6 = 6;
int led9 = 9;
int led10 = 10;
int led11 = 11;

void setup() {
pinMode(pressure,INPUT);  //set press to be an input
pinMode(5,OUTPUT);
pinMode(6, OUTPUT);
pinMode(9,OUTPUT);
pinMode(10,OUTPUT);
pinMode(11,OUTPUT);

Serial.begin(9600); // initialize communication
}

void loop() {
  // put your main code here, to run repeatedly:
 touchValue = readCapacitivePin(pressure); //read the touch sensor value

  if(touchValue == 1 && flag == 0) {
    digitalWrite(led5,LOW);
    digitalWrite(led6,LOW);
    digitalWrite(led9,LOW);
    digitalWrite(led10,LOW);
    digitalWrite(led11,LOW);
  }

  else {
    flag = 1;
    for(value = 0; value <= 255; value +=5) //fade LEDs in

  {
    analogWrite(led5,value);
    analogWrite(led6,value);
    analogWrite(led9,value);
    analogWrite(led10,value);
    analogWrite(led11,value);
     delay(10); //take 30 milliseconds to fade in
    }
  }
//  else {
//    for(value = 255; value >= 0; value -=5) //fade LEDs out
//  {
//    analogWrite(led5,value);
//    analogWrite(led6,value);
//    analogWrite(led9,value);
//    analogWrite(led10,value);
//    analogWrite(led11,value);
//    delay(10); //take 30 milliseconds to fade in

  // wait for 40 milliseconds to see the dimming effect
  delay(300);
Serial.println(touchValue); //send touchValue to the computer
//delay(100); //delay for 1/10 of a second
}


RESULTS & REFLECTIONS
- The capacitive pressure sensor was very easy to make. It only took some conductive yarn and an Analog Pin on Arduino. It was pretty sensitive and it worked to turn on the LED sequence.
- In a future iteration, this button will be complemented with the heartrate sensor and vibration motors (see Final Project).
- It would be interesting to play with the length and the size of the sensor, in order to measure the difference in capacitance.
You can find the Arduino code files here.